Transforming the employee experience with data science
I was the principal data scientist in the development of the EY PX360 People Experience Transformation Platform, which is a solution created by EY in close collaboration with SAP SuccessFactors and Qualtrics
The solution was given the SAP Pinnacle Award in 2020 and was an important factor in EY being named Qualtrics Employee Experience Partner of the Year in 2020.


The PX360 platform
The EY PX360 solution was developed by EY as a proprietary platform which combines an organization’s operational data, such as attrition, with experience data, such as employee engagement, to optimize the entire employee experience.
The initial deployment of the platform was done with EY itself as the first use‑case to prove out how this technology and framework can be used to improve the experiences of EY’s own employees across the globe.
Successes and risks
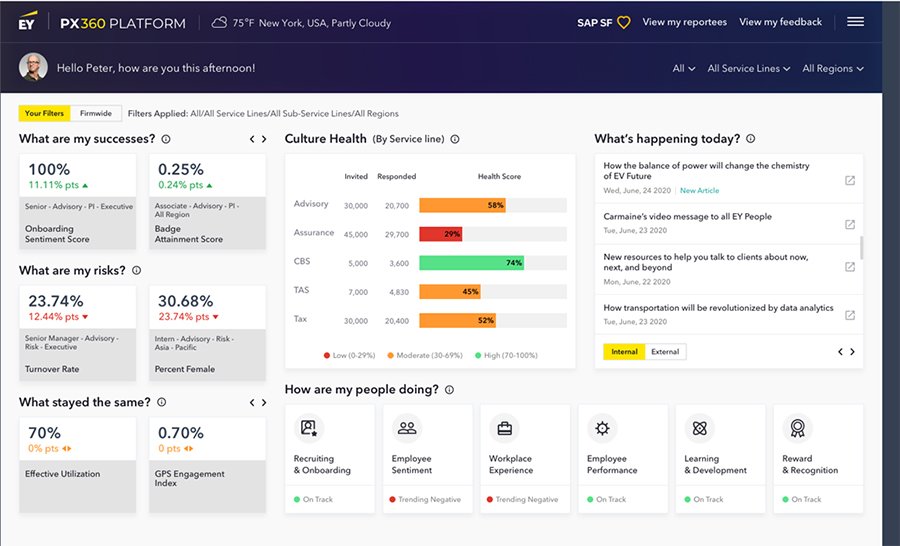
The intended audience for the platform is HR managers and they have access through a landing page with curated content and carefully selected key performance indicators (KPIs).
I was responsible for defining and implementing a methodology to determine whether a given KPI represented a “Success”, a “Risk”, or had stayed the same as shown to the left in the sample landing page above.
This definition was also used to determine the magnitude of the change and with that the order in which the KPIs were presented to the user with the biggest success or risk shown first. Since some KPIs may historically be more volatile, determining the relative change is more complicated than just looking at the change in absolute terms or as a percentage.
Furthermore, different KPIs may also be measured in different units that are not easily comparable.
The methodology had to take all of this into consideration and the calculations had to be both scalable and maintainable as each KPI would need to be computed for each group and sub-group of the organization; in the case of EY, we had the 2,877 distinct groups and sub‑groups within the global organization combined with (at the time) 14 different KPIs resulting in more than 40,000 values that needed to be computed and classified each month.
These calculations are not only used on the landing page but also powers the IBM Watson chatbot that is part of the platform and allows the user to ask questions in natural language and get responses back from the chatbot based on the data that is available to the solution.
Identify correlations
The intended audience for the platform is HR managers and they have access through a landing page with curated content and carefully selected key performance indicators (KPIs).
I was responsible for defining and implementing a methodology to determine whether a given KPI represented a “Success”, a “Risk”, or had stayed the same as shown to the left in the sample landing page above.
This definition was also used to determine the magnitude of the change and with that the order in which the KPIs were presented to the user with the biggest success or risk shown first. Since some KPIs may historically be more volatile, determining the relative change is more complicated than just looking at the change in absolute terms or as a percentage.
Furthermore, different KPIs may also be measured in different units that are not easily comparable.
The methodology had to take all of this into consideration and the calculations had to be both scalable and maintainable as each KPI would need to be computed for each group and sub-group of the organization; in the case of EY, we had the 2,877 distinct groups and sub‑groups within the global organization combined with (at the time) 14 different KPIs resulting in more than 40,000 values that needed to be computed and classified each month.
These calculations are not only used on the landing page but also powers the IBM Watson chatbot that is part of the platform and allows the user to ask questions in natural language and get responses back from the chatbot based on the data that is available to the solution.
Key drivers
I was subsequently put in charge of identifying additional ways in which the platform could be enhanced by the application of data science and machine learning.
At this point, the amount of data and different features or variables that were available had made it difficult to navigate the dashboards and to find the relevant information, so I proposed the idea of identifying the features that were the key drivers for each of the KPIs and look at the unique drivers within each group and sub‑group of the organization.
I led a team of 4 data scientists that worked on developing this functionality by training a predictive model for each of the KPIs and then extracting the predictor importance from those models, which is then displayed as a guide to the user on the landing page along with the recent change to each of the drivers and can be used to easily navigate to the dashboards with the most important underlying changes.
This is developed to be a dynamic functionality that will recompute the key drivers with each refresh of the data as these relationships could change over time as the organization makes adjustments to bolster successes and fend off risks.


”Kenneth combines a very rare mix of innovative thinking, application of AI and advanced analytics, and project leadership to solve very tough business problems in unique ways. Kenneth was the driver of all of our analytics on which the PX360 platform was built and greatly contributed to winning a SAP Pinnacle Award and Qualtrics EX Partner of the Year. ”
Michael Miscisin
Senior Manager
Ernst & Young
Media coverage
EY collaborates with SAP SuccessFactors, Qualtrics on differentiated employee experience solution
Mesa Online, September 17, 2019
Ernst & Young announces its collaboration with SAP SuccessFactors and Qualtrics to release the EY PX360 People Experience Transformation Platform.
EY 'people experience' strategy taps firm's process skills
TechTarget, September 22, 2020
The accounting and consulting firm is integrating a mix of shared services, bot-enabled workflows, SuccessFactors HXM and Qualtrics employee engagement for its global workforce.
Kenneth A Jensen
A data science practitioner who will deliver results at every stage of the analytics lifecycle